Exploring Amazon Athena in Incident Response: A Practical Approach
Recently, our team was pulled into an incident response engagement. As part of the breach investigation, we needed to review months of extensive nginx log files stored on Amazon S3 to determine an application issue causing data leakage. Complicating matters, we had no access to our traditional SIEM tools, prompting us to explore alternative solutions. We explored leveraging Amazon Athena to directly query the logs stored in S3.
The post will showcase Amazon Athena's relevance in Incident Response while highlighting the importance of adaptability and strategic thinking in the ever-evolving cybersecurity landscape.
To set some context, we were interested in answering some of the following questions:
- Which endpoints were hit most regularly by a single IP address? This may surface a potential vulnerability that may have been tested and/or exploited.
- Which IP addresses were the most noisy? This may shed light on potential Threat Actors or compromised internal systems.
- Were there any attack payloads that could be an Indicator of Compromise? Similar to point 1, this is helpful to understand areas that have been exposed externally.
We had some additional considerations in our search:
- The client was most interested in requests between a specific time period.
- The client had a set of IP addresses that belonged to their approved security testers. These addresses were expected to include traffic with known malicious behaviors.
Understanding the Log format
Before investing too much time into searching log files, it’s critical to understand the logging structure. Many services provide the ability to configure log formatting, which in turn could result in log files being in a different format across services. For instance, Client A and Client B may both be using the same version of nginx, but could have a drastically different format of log files.
When possible, look at the service configuration file to understand specifically what log format is in use. If config files are unavailable, it can be a bit of a guessing game since some of the attributes may not regularly show up (User, X-Forwarded-For, etc.).
log_format  main  '$remote_addr - $remote_user [$time_local] "$request" '
                      '$status $body_bytes_sent "$http_referer" '
                      '"$http_user_agent" "$http_x_forwarded_for"';
The above configuration could result in the following log entry:
77.55.99.2 - - [05/Feb/2022:11:25:40 -0500] "GET /app/images/information.png HTTP/1.1" 200 644 "-" "Mozilla/5.0 (Windows NT 10.0; Win64; x64) AppleWebKit/537.36 (KHTML, like Gecko) Chrome/114.0.0.0 Safari/537.36" "-"Building the Schema
Once we had an understanding of the log file structure, the next step was to explore building the table schema. Our approach to building the schema was to include a column for every attribute that was being logged. This would allow us to search and aggregate by any of those attributes. In our case, this resulted in 9 distinct columns: client_ip, user_id, request_received_time, client_request, server_status, returned_obj_size, referrer, user_agent, x_fwd_for.
Through our research and various examples, we stumbled across the usage of different Serializer/Deserializers (SerDe). These SerDe are how log files are parsed into columns in an automated manner. Most commonly, though, examples were utilizing either the Regex or Grok SerDe.
Our first approach was to utilize Regex to parse out the columns. We continuously ran into an error “Number of matching groups doesn't match the number of columns” that we were unable to solve. We utilized three different Regex testers to verify that the number of match groups did in fact match the number of columns. Because we were under a time crunch, we decided to look at other options.
The GrokSerDe was used fairly widely in examples and utilized a familiar, well-defined syntax with flexibility. We utilized the following pattern, which matched the structure of our log entries:
'input.format'='^%{IPV4:client_ip} - %{USERNAME:user_id} %{GREEDYDATA:request_received_time} %{QUOTEDSTRING:client_request} %{DATA:server_status} %{DATA: returned_obj_size} "%{DATA: referer}" "%{DATA: user_agent}" "%{DATA: x_fwd_for}"$'From that point, we generated our table creation query based on the examples provided via AWS Documentation:
CREATE EXTERNAL TABLE logs(
  client_ip string,
  user_id string,
  request_received_time string,
  client_request string,
  server_status string,
  returned_obj_size string,
  referer string,
  user_agent string,
  x_fwd_for string
  )
ROW FORMAT SERDE
   'com.amazonaws.glue.serde.GrokSerDe'
WITH SERDEPROPERTIES (
   'input.format'='^%{IPV4:client_ip} - %{USERNAME:user_id} %{GREEDYDATA:request_received_time} %{QUOTEDSTRING:client_request} %{DATA:server_status} %{DATA: returned_obj_size} "%{DATA: referer}" "%{DATA: user_agent}" "%{DATA: x_fwd_for}"$'
   )
STORED AS INPUTFORMAT
   'org.apache.hadoop.mapred.TextInputFormat'
OUTPUTFORMAT
   'org.apache.hadoop.hive.ql.io.HiveIgnoreKeyTextOutputFormat'
LOCATION
   's3://BUCKET_PATH_TO_LOGS/';
With that query, a table will be created. But there’s one more caveat to share.
Glacier Archives cannot be accessed by Athena
Before getting much further, it’s worth calling out one important factor: Logs that have been archived by S3 Glacier cannot be accessed by Athena. This means that those files will need to be restored in order to be queryable. This restoration can take several hours up to a full day, depending on the archival. For more information, please refer to Amazon documentation: Restoring an archived object
Performing the Search
Once the table is created, it should be possible to begin querying the data. It’s a good idea to take a quick sample of the data to ensure that items are being deserialized as expected.
SELECT * FROM "default"."logs" limit 10;Grouping by IP:
Grouping requests by IP will help to discover particularly noisy addresses, which are often signs of automated scanners.
SELECT client_ip, COUNT(*) FROM "default"."apache_logs" GROUP BY client_ip;Finding the most hits to a particular endpoint:
The following query will aggregate all requests to endpoints and a list of endpoints and request counts, sorted by count size.
SELECT "client_request", count(*) as request_count FROM "apache_logs" GROUP BY "client_request" ORDER BY request_count DESC;Searching for attack patterns:
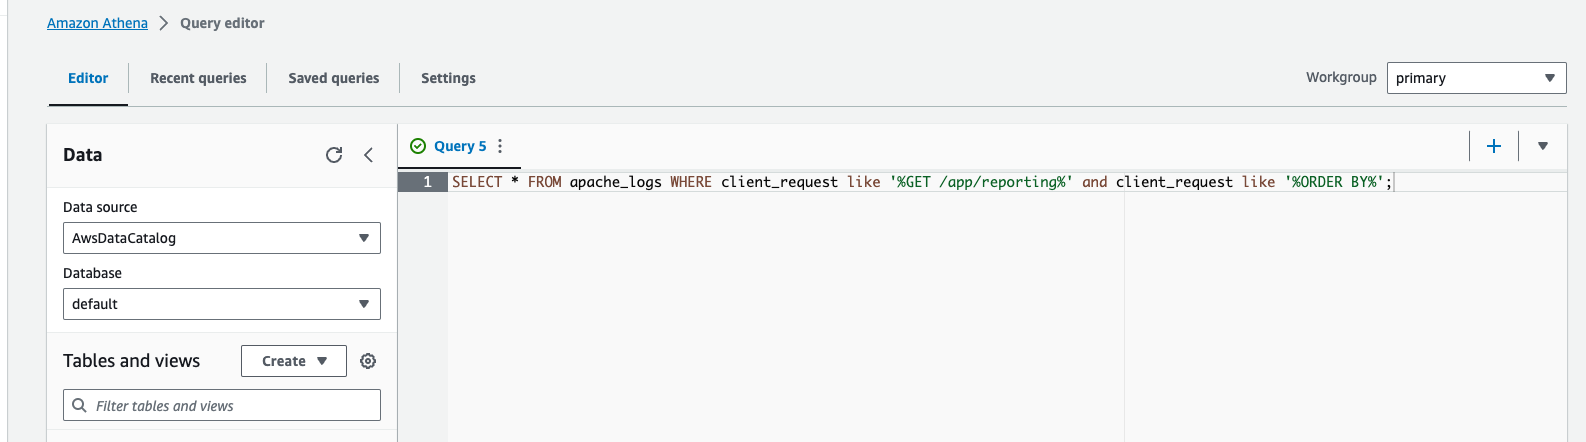
The following query looks for any GET request to the /app/reporting endpoint, which also contains an ORDER BY statement. This is an indication of a potential SQL Injection attack.
SELECT * FROM apache_logs WHERE client_request like '%GET /app/reporting%' and client_request like '%ORDER BY%';Filtering out legitimate IP Addresses:
The following query can be used to filter out results that contain specific IP addresses.
SELECT * FROM apache_logs WHERE client_ip NOT IN ('11.55.5.3', '77.55.99.2')Conclusion
Overall, we were happy with Athena’s performance for this engagement. Getting started is extremely quick for environments that already store log files in S3. Within minutes of starting the setup process, we were able to begin querying across months worth of access log files in a very performant manner. Athena offers a straightforward integration with logs stored in S3, but it is far from a complete solution for log searching and SIEM use cases.
All companies, small or large, need a log aggregation and searching solution. It's best to have a solution in place before you need it versus putting it together during an incident. We work with our customers to pick and integrate the best solution for their environment. Reach out to have a conversation on what works best for you!
John Poulin is an experienced Application Security Practitioner with over 10 years of experience in software development and security. Over his tenure, John has worked with many Fortune 500 companies and startups alike to perform secure code review, architecture, and design discussions, as well as threat modeling.